India's GDP ~ Where We Lack and What We Need... A Supply Side View

INTRODUCTION
As I had mentioned in one of my previous articles{https://analysiswithshaurya.blogspot.com/2020/08/gdp-calculation-limitations.html} about GDP, that it is both the aggregate expenditure as well as aggregate output produced in an economy.In this article, I will present a brief analysis on Indian Output(GDP) since 2013 on basis of production function approach.
To have a clear understanding about the analysis, understanding the approach and assumption used is the preliminary requirement. So let us walk through the basics of the production function approach.
PRODUCTION FUNCTION APPROACH - A Small Walk
In the production function approach, Aggregate output is calculated as a function of A,K,and L.
Y=A*f(K,L).......(1)
Here,
Y= aggregate output
A= Total Factor Productivity/ Residual ; The policies in a country, its economic structure, technological advancement. In one word we can say it is “ ease of doing business”
K= capital
L= labour.
Now the equation(1) is further expanded as,
Y= A*Ka *L(1-a)……………(2)
Here you can see one more algebraic term ~ “a”, this is the contribution of capital growth in the output growth and “1-a” is the contribution of labor employment growth in total output growth.
Now instead of digging the equation further I will direct the article towards assumptions used 𝚫and then quickly towards the analysis.
ASSUMPTIONS
OUTPUT GROWTH DECOMPOSITION ~ Bedrock of Analysis
%𝚫Y=%𝚫A+(a%𝚫K)+(1-a)%𝚫L ……… {%𝚫= percent change}
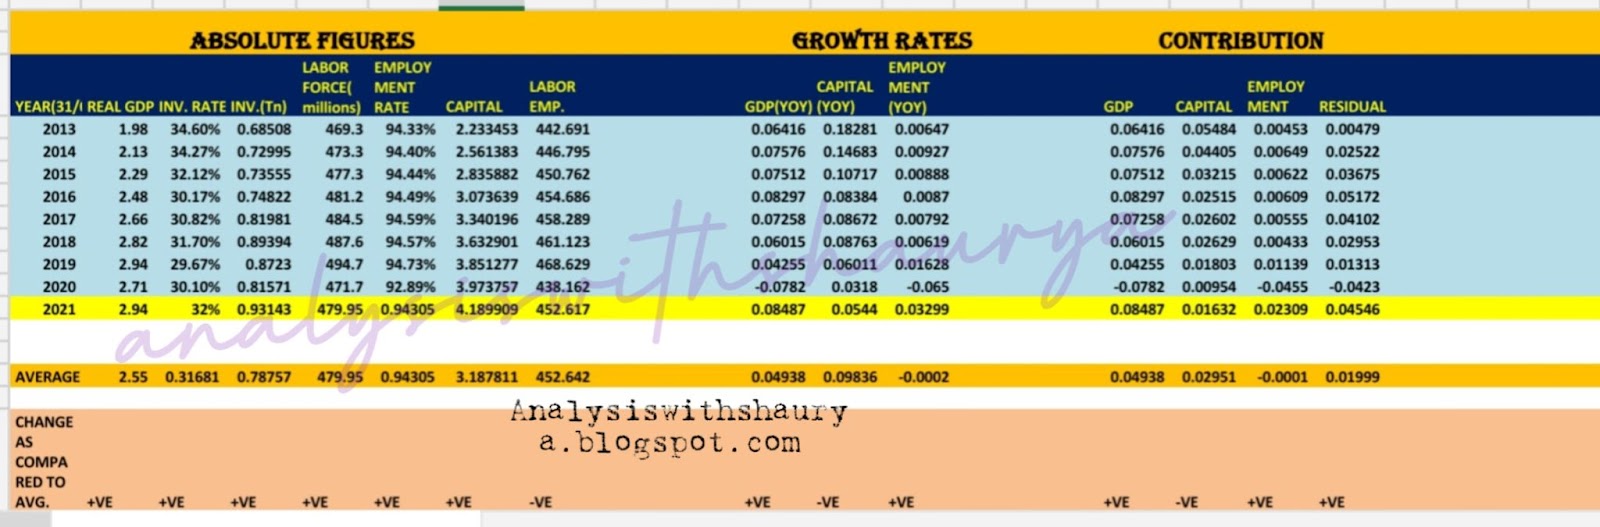
In the above picture, the 2nd row represents the title of the columns, further the yellowish row is the prediction made by ICRA that the real GDP growth will be 8.5%. The orange column is the average of the respective columns and the last row is the comparison of the year 2021 prediction(yellow column) with the average of respective columns(orange).
PORTRAYAL ~ Interpreting the Observations
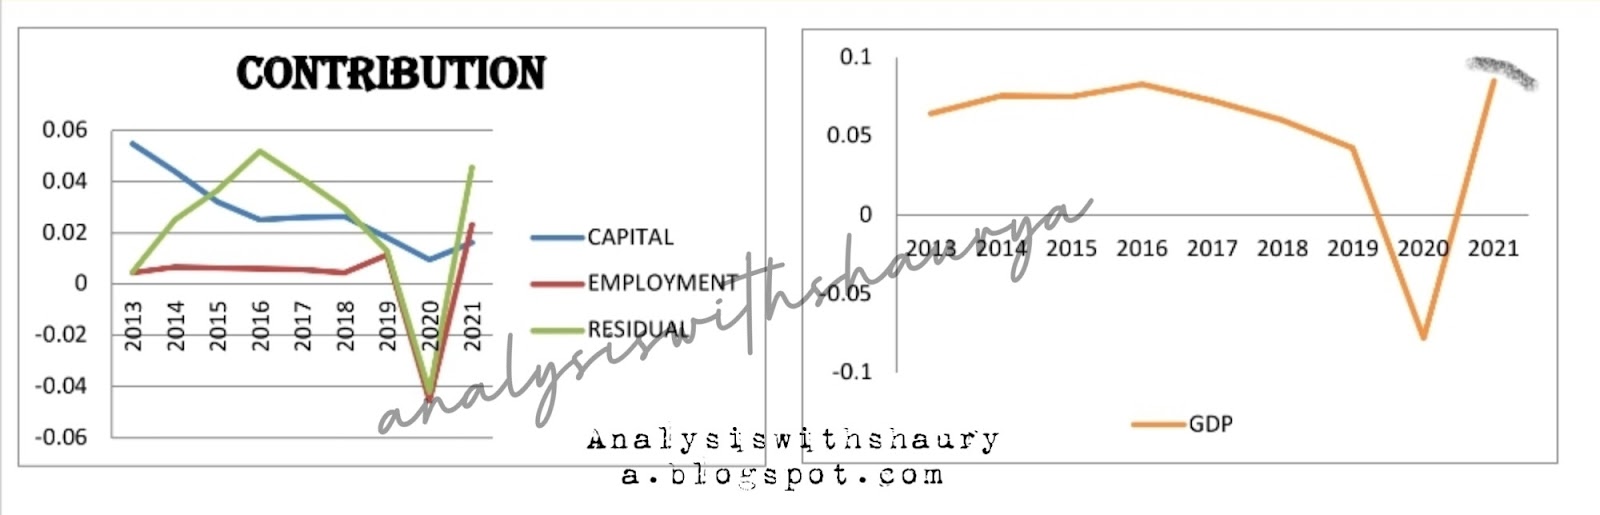
There are two figures in the above picture, the left one shows the contributions made by the three components (Residual,Capital,Employment), which we discussed during the commencement of analysis.
The right figure is the Real GDP growth.
Now, it can be clearly seen that our real GDP growth has been declining since 2016, and this is largely caused due to the decline in labor employment and the residual(A) part.
After examining the data and chart, it can be said that the business firms were finding it hard to earn profits, it's not like they didn’t try to improve profits, as it can be seen that from 2016-2018, even after continuous decline in GDP, the capital growth rate is increasing marginally.
But the whole turmoil began when the employment rate started declining(2016), which led to a decline in the income of the workers. Now it doesn’t matter how much the manufacturer is producing, if the customers aren’t willing to buy, the produced goods will become idle inventory.
This same happened from 2016, a decline in income (due to decline in employment), contributed in decreasing the purchasing power of people in the economy and the demand started puncturing and when covid was all over in the air, the tyre got burst which led to a negative growth in real GDP.
CONJECTUREs ~ Concluding the Argument
Long term sustainable growth will require change in Economic policies, ethical motives for using funds, a strong banking and financial sector, massive focus on export promotion rather than import substitution. This all comes under the “A” ( residual) part of eq(1), this shows results over a long period of time on a gradual basis.
While in the short term we need to focus more on the capital & employment part.ICRA has predicted 8.5% growth for FY 2022. It is not impossible but some steps are necessary.
Increasing labor employment : This in turn will revive the demand as workers will have an income security and will not have to depend on their contingency reserves.
Assisting the suppliers by lowering restrictions on movement: this will increase the profits of businessmen and will further lead to an increase in capital appreciation as they will earn more than before.
Lowering restrictions will also help in dealing with food inflation as prices of commodities are higher because businessmen are finding it difficult to earn profits.
There must be an attempt on increasing export promotion, as this will decrease the trade deficit and will contribute to GDP growth.
Every step depends on how fast the vaccination drive will go because the lifting of lockdown restriction will be directly proportional to the vaccination process. As more and more people will get vaccinated, lockdown restrictions will be lifted. This will assist suppliers in easy movement of goods and also the workers in finding jobs without the threat of virus (as compared to prior to vaccination).
Thus, in one note we can conclude our analysis to economic recovery by saying that
“ Faster the vaccination drive, quicker the economic recovery”.
Shaurya Gupta
B.com hons, University of Delhi
Financial Markets hons, Yale University


U did a great search
ReplyDeletethank you....
Delete